GWAS: population structure and association
Your evaluation brief
Does a pooled association establish a variant effect when group composition differs between cases and controls? This original synthetic example supplies carrier counts for one fictional autosomal variant in two fictional genetic-background strata, A and B. The strata are teaching labels, not demographic or racial categories.
Read cases/gwas/README.md and cases/gwas/simulated-response.md. The table cases/gwas/data/carrier-counts.tsv summarizes 400 distinct unrelated participants. A carrier has at least one copy of the designated allele. Counts are people, not alleles; this is a carrier-based comparison, not an additive dosage GWAS.
Plan your review
Create results/ch08/evidence-log.tsv and evaluate each of the six claims. Check totals, compare group composition, and calculate carrier odds ratios within each stratum before pooling.
Population structure can confound genetic associations; appropriate analyses assess and account for it (Price et al. 2006). This case uses known strata to illustrate the problem. It does not calculate principal components or implement a full GWAS correction.
Verify selected properties
Rscript scripts/R/08-verify-gwas.RRun from the repository root. The base-R script validates the count table and writes:
Output in results/ch08/ |
Purpose |
|---|---|
association-checks.tsv |
Compare carrier proportions and odds ratios within strata and pooled. |
composition.tsv |
Check the proportion from each stratum among cases and controls. |
input-checksums.tsv, session-info.txt |
Record inputs and software details. |
For each comparison, calculate (case carriers × control noncarriers) / (case noncarriers × control carriers). Odds ratios are not risk ratios. All cells are positive in this exercise; the script stops on zero cells rather than silently choosing a correction.
Outputs are overwritten on rerun. The script produces no p-values, confidence intervals, ancestry estimates, or adjusted genome-wide analysis.
Write your evaluation
Save results/ch08/evaluation-report.md. Explain why pooled and within-stratum results differ and what can be concluded from this table. Identify the missing evidence needed to evaluate a real GWAS: genotype and sample QC, relatedness, population structure, the association model, multiple-testing control, and replication.
Genome-wide significance cannot be established from a single descriptive table. A marker association alone also does not identify a causal variant or causal gene; linked variants and functional evidence require further investigation.
There are 200 cases and 200 controls. Within A, carrier proportions are 80% for both; within B, they are 20% for both. Each within-stratum odds ratio is 1. Pooled proportions are 68% and 32%, producing an odds ratio of 4.515625.
Cases are 80% stratum A, whereas controls are 20% stratum A. The pooled association reflects the different group mixtures in this constructed example. The within-stratum point estimates do not establish equivalence or exclude small effects in a population.
Compare your judgments with cases/gwas/worked-review.md.
Reference values were calculated independently with Python. The R script has not been executed in the authoring environment. Record your actual run and compare it with cases/gwas/reference/.
Read the visual evidence
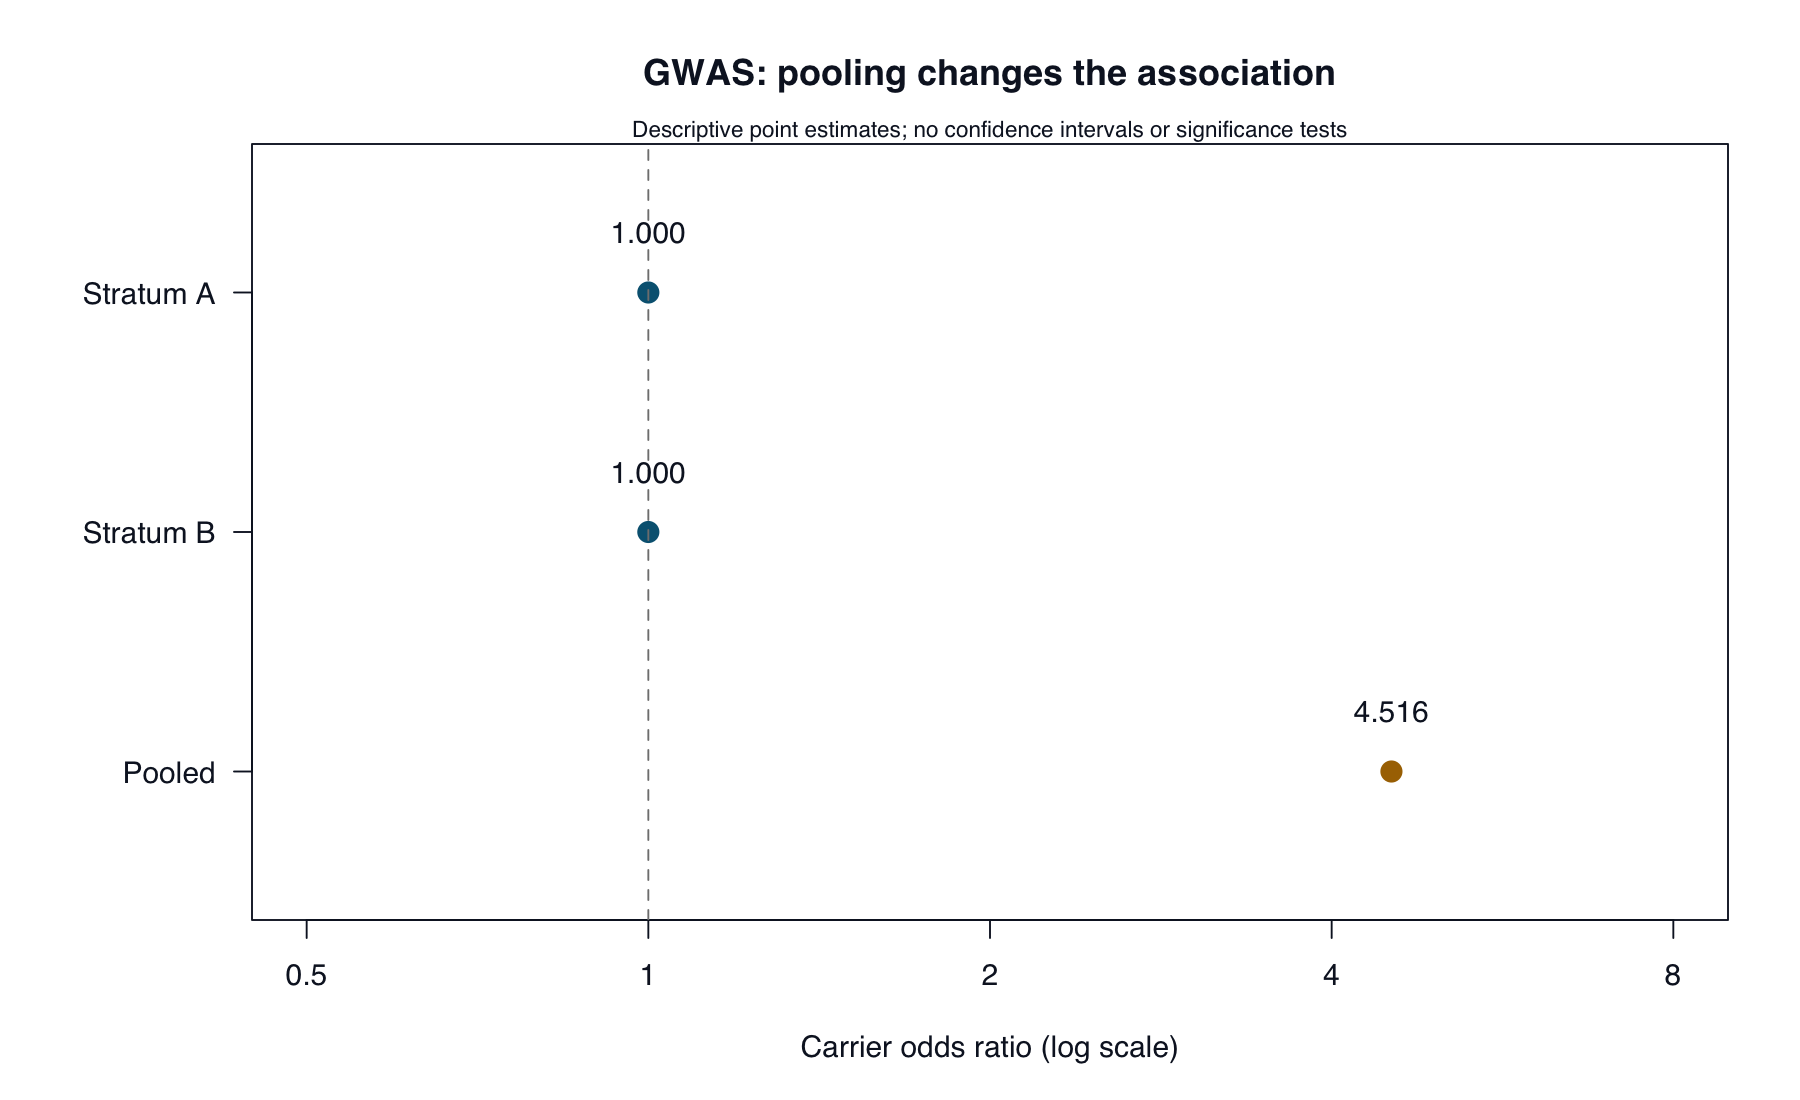
Points are descriptive estimates on a logarithmic axis. No confidence intervals, significance tests, or causal conclusions are supplied.
Run from the repository root:
Rscript scripts/R/plot-evaluation-cases.RView or download the base-R plotting code. It reads the supplied case data and regenerates all five figures in results/figures/. Existing images are overwritten; book rendering does not run this script.
The bundled PNGs were generated with the Python plotting code. The R alternative uses the same inputs and calculations but has not been executed in the authoring environment. Layout may differ slightly.
Continue to Independent Evaluation to bring the review process together.