Proteomics: missing values and interpretation
Your evaluation brief
Does an apparent protein increase survive a change in missing-value assumptions? This original synthetic case contains six independent biological samples, three per condition, and three fictional protein groups. Values are supplied log2 intensities; NA means not quantified. No raw spectra, peptide evidence, normalization record, or statistical analysis is provided.
Read cases/proteomics/README.md and cases/proteomics/simulated-response.md. The data folder contains sample-metadata.tsv and log2-intensities.tsv. Protein groups are teaching identifiers, not validated biological entities.
Plan your review
Create results/ch07/evidence-log.tsv. Evaluate each of the six claims before opening the worked review. Identify the biological replicates, count missing measurements by condition, and distinguish an observed difference from an assumption-dependent result.
Imputation depends on assumptions about why values are missing; a missing measurement does not identify its own mechanism (Lazar et al. 2016). Here, replacing missing values with 18 or 22 is a deliberately simplified sensitivity exercise, not a recommended analysis method.
Verify selected properties
Run from the repository root:
Rscript scripts/R/07-verify-proteomics.RThe base-R script checks identifiers and numeric inputs, then writes:
Output in results/ch07/ |
Purpose |
|---|---|
missingness.tsv |
Count observed and missing values per protein and condition. |
sensitivity.tsv |
Compare observed-only means with two fixed-value replacements. |
input-checksums.tsv, session-info.txt |
Record input fingerprints and software details. |
The reported difference is mean log2 intensity in treated samples minus mean log2 intensity in controls. Its exponent, 2^difference, is a ratio of geometric means on the original scale, not a ratio of arithmetic means. Observed-only summaries may use different numbers of samples and do not remove missing-data bias.
The script overwrites its named outputs. It performs no normalization, differential-abundance test, or protein-identification validation.
Write your evaluation
Save a concise report to results/ch07/evaluation-report.md. Retain valid arithmetic, identify conclusions that depend on replacement values, and request the evidence needed to assess normalization, identification, and uncertainty. Do not substitute an arbitrary replacement rule for a justified missing-data strategy.
P1 has three observed controls and one observed treated value. Its treated-minus-control difference is 2 using observed values, approximately -3.333 when missing values are replaced with 18, and -0.667 when replaced with 22. These correspond to geometric-mean ratios of 4, approximately 0.099, and approximately 0.630.
P2 has complete measurements and a descriptive difference of 1; P3 has complete measurements and a difference of 0. Neither supplies a significance test. Compare your six judgments with cases/proteomics/worked-review.md.
Reference tables were calculated independently with Python. The R script has not been executed in the authoring environment; compare your run with cases/proteomics/reference/ and record discrepancies.
Read the visual evidence
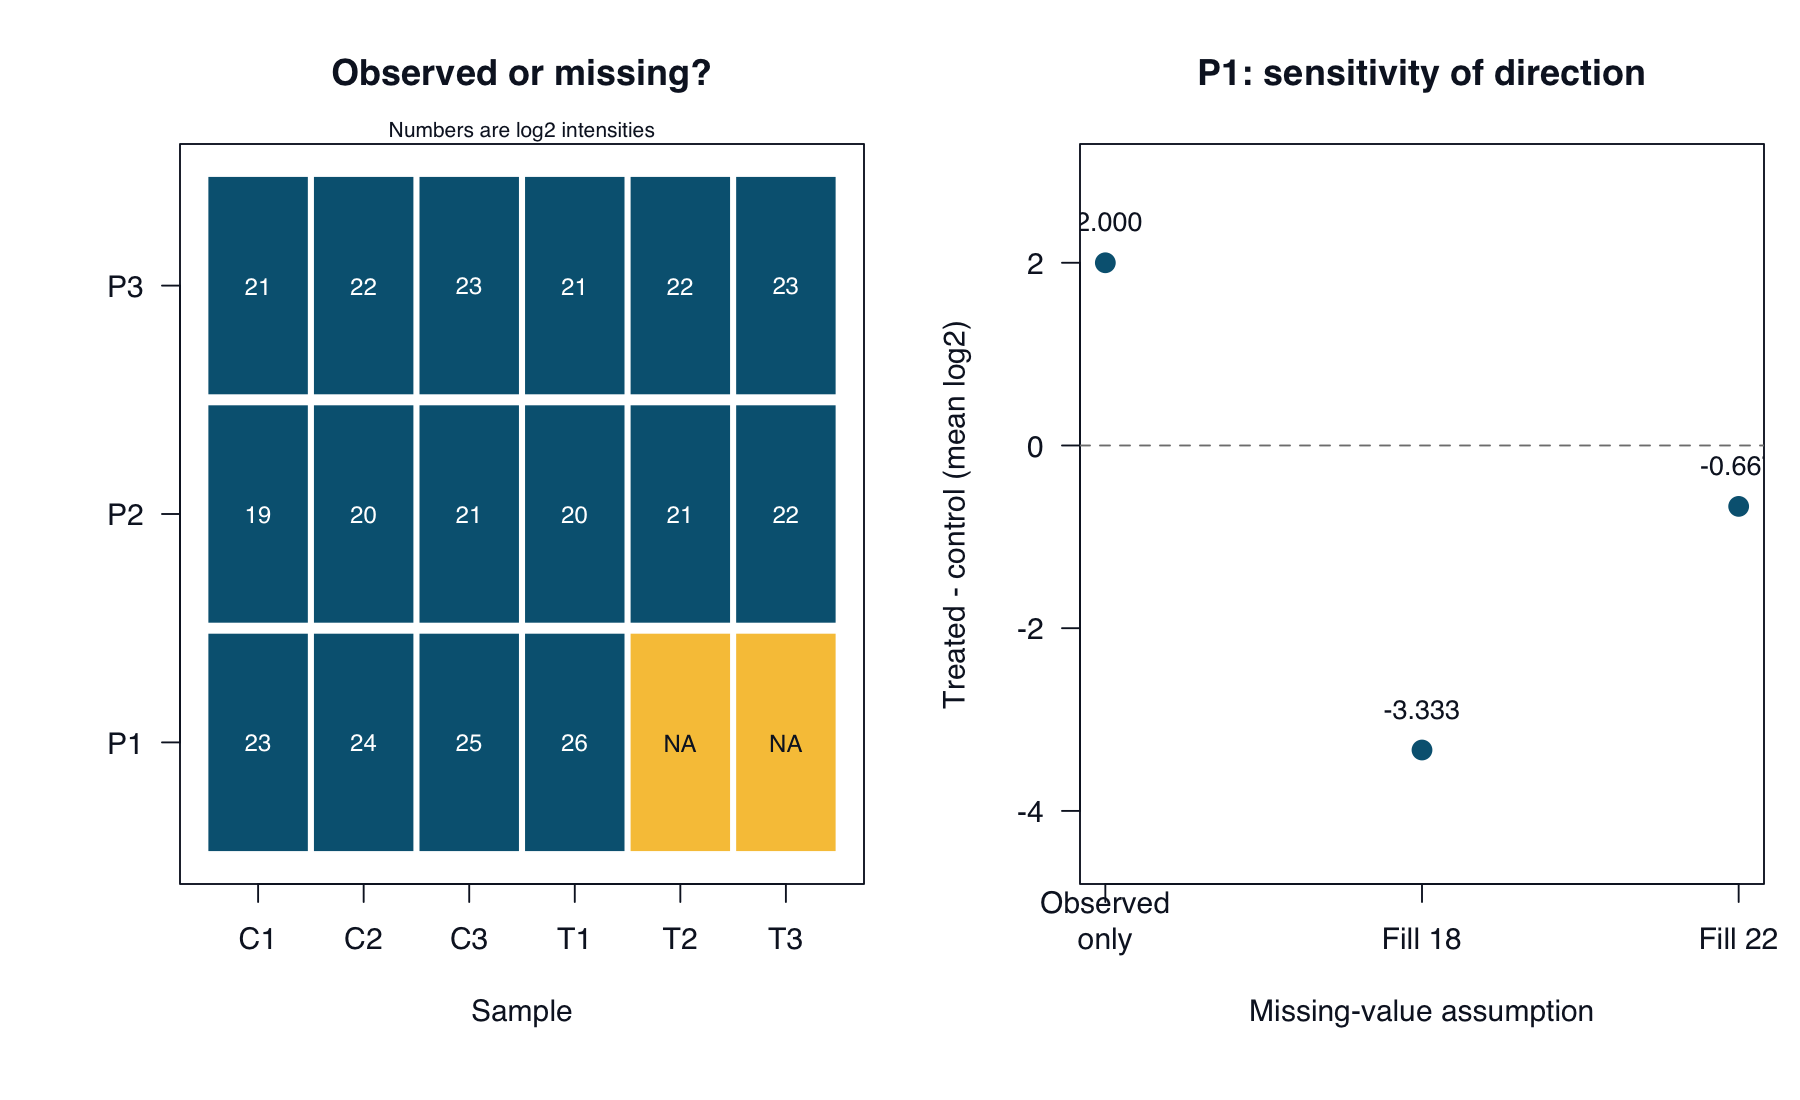
Teal cells are observed log2 intensities; yellow cells are missing. Replacement values illustrate sensitivity and are not recommended imputation methods.
Run from the repository root:
Rscript scripts/R/plot-evaluation-cases.RView or download the base-R plotting code. It reads the supplied case data and regenerates all five figures in results/figures/. Existing images are overwritten; book rendering does not run this script.
The bundled PNGs were generated with the Python plotting code. The R alternative uses the same inputs and calculations but has not been executed in the authoring environment. Layout may differ slightly.
Continue to GWAS to examine population structure and association claims.